
LLDB是Xcode默认的调试器,它与LLVM编译器一起,带给我们更丰富的流程控制和数据检测的调试功能。平时用Xcode运行程序,实际走的都是LLDB。熟练使用LLDB,可以让你debug事半功倍。
LLDB 命令还是不少的,但有些都集成在 Xcode 的图形化界面中,没必要再去手动操作,这里主要说一下使用起来更加高效的一些命令。
Features
help
和大多数命令一样,help 命令会显示出所有的命令列表,对于相关的操作可以直接查看。 若想查看某一条命令的话,直接在 help 后面加上对应的命令名称。如:
help print
p & call & po
先说 p 和 call, 二者都是 expression – 的别名, p 为 print 的简写,同时可以写为 pri,打印某个东西,可以i是变量和表达式; call 为调用某个方法,输出变量也是可以的。
po 一般用于打印对象,是 expression -O – 的别名。
p 和 po 的区别在于使用 po 只会输出对应的值,而 p 则会返回值的类型以及命令结果的引用名。如:
(lldb) p self.model.number
(float) $4 = 98
(lldb) p self.model.name
(NSString *) $5 = nil
(lldb) po self.model.number
98
(lldb) po self.model.words
Hello
expression
expression 命令的作用是执行一个表达式,并将表达式返回的结果输出。expression的完整语法是这样的:
expression (cmd-options) -- (expr)
说明下参数:
- (cmd-options):命令选项,一般情况下使用默认的即可,不需要特别标明。
- – –: 命令选项结束符,表示所有的命令选项已经设置完毕,如果没有命令选项,–可以省略。
- (expr): 要执行的表达式
说 expression 是LLDB里面最重要的命令都不为过。因为他能实现2个功能。
- 执行某个表达式。 我们在代码运行过程中,可以通过执行某个表达式来动态改变程序运行的轨迹。 假如我们在运行过程中,突然想把 self.view 颜色改成红色,看看效果。我们不必写下代码,重新run,只需暂停程序,用expression改变颜色,再刷新一下界面,就能看到效果
// 改变颜色
(lldb) expression -- self.view.backgroundColor = [UIColor redColor]
// 刷新界面
(lldb) expression -- (void)[CATransaction flush]
- 将返回值输出。 也就是说我们可以通过expression来打印东西。 假如我们想打印 self.view :
(lldb) expression -- self.view
(UIView *) $1 = 0x00007fe322c18a10
thread
backtrace & bt
此命令一般用于将线程的堆栈打印出来,一般在程序出现 crash的时候调用。如;
(lldb) thread backtrace
* thread #1: tid = 0xdd42, 0x000000010afb380b libobjc.A.dylib`objc_msgSend + 11, queue = 'com.apple.main-thread', stop reason = EXC_BAD_ACCESS (code=EXC_I386_GPFLT)
    frame #0: 0x000000010afb380b libobjc.A.dylib`objc_msgSend + 11
  * frame #1: 0x000000010aa9f75e TLLDB`-[ViewController viewDidLoad](self=0x00007fa270e1f440, _cmd="viewDidLoad") + 174 at ViewController.m:23
    frame #2: 0x000000010ba67f98 UIKit`-[UIViewController loadViewIfRequired] + 1198
    frame #3: 0x000000010ba682e7 UIKit`-[UIViewController view] + 27
    frame #4: 0x000000010b93eab0 UIKit`-[UIWindow addRootViewControllerViewIfPossible] + 61
    frame #5: 0x000000010b93f199 UIKit`-[UIWindow _setHidden:forced:] + 282
    frame #6: 0x000000010b950c2e UIKit`-[UIWindow makeKeyAndVisible] + 42
bt 为 thread backtrace 的别名,直接使用 bt 和使用上面那一长串是一个效果。
thread return
Debug的时候,也许会因为各种原因,我们不想让代码执行某个方法,或者要直接返回一个想要的值。这时候就该thread return上场了。
thread return [expr]
thread return可以接受一个表达式,调用命令之后直接从当前的堆栈中返回表达式的值。
e.g: 我们有一个 someMethod 方法,默认情况下是返回YES。我们想要让他返回NO
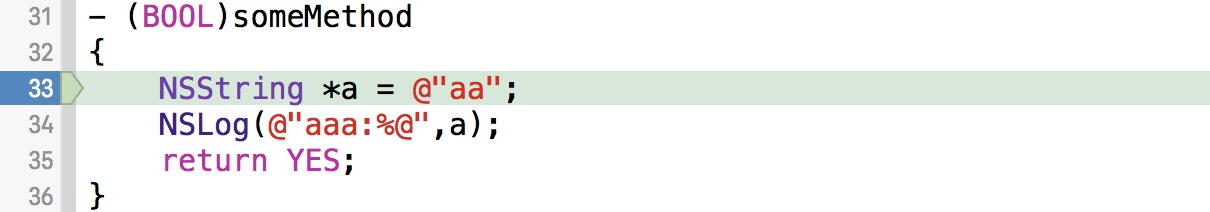
我们只需在方法的开始位置加一个断点,当程序中断的时候,输入命令即可:
(lldb) thread return NO
效果相当于在断点位置直接调用 return NO;,不会执行断点后面的代码.
target
对于target这个命令,我们用得最多的可能就是 target modules lookup。由于 LLDB 给 target modules 取了个别名 image,所以这个命令我们又可以写成 image lookup。
image lookup –address
当我们有一个地址,想查找这个地址具体对应的文件位置,可以使用 image lookup –address ,简写为 image lookup -a。 e.g: 当我们发生一个crash
*** Terminating app due to uncaught exception 'NSRangeException', reason: '*** -[__NSArray0 objectAtIndex:]: index 1 beyond bounds for empty NSArray'
*** First throw call stack:
(
    0   CoreFoundation                      0x000000010accde65 __exceptionPreprocess + 165
    1   libobjc.A.dylib                     0x000000010a746deb objc_exception_throw + 48
    2   CoreFoundation                      0x000000010ac7c395 -[__NSArray0 objectAtIndex:] + 101
    3   TLLDB                               0x000000010a1c3e36 -[ViewController viewDidLoad] + 86
    4   UIKit                               0x000000010b210f98 -[UIViewController loadViewIfRequired] + 1198
    5   UIKit                               0x000000010b2112e7 -[UIViewController view] + 27
我们可以看到是由于-[__NSArray0 objectAtIndex:]:超出边界而导致的crash,但是objectAtIndex:的代码到底在哪儿呢?
(lldb) image lookup -a 0x000000010a1c3e36
      Address: TLLDB[0x0000000100000e36] (TLLDB.__TEXT.__text + 246)
      Summary: TLLDB`-[ViewController viewDidLoad] + 86 at ViewController.m:32
根据0x000000010a1c3e36 -[ViewController viewDidLoad]里面的地址,使用image lookup –address查找,我们可以看到代码位置在ViewController.m里面的32行。
image lookup –name
当我们想查找一个方法或者符号的信息,比如所在文件位置等。我们可以使用 image lookup –name ,简写为 image lookup -n。
e.g: 刚刚遇到的真问题,某个第三方SDK用了一个我们项目里原有的第三方库,库里面对 NSDictionary 添加了 category 。也就是有2个 class 对 NSDictionary 添加了名字相同的 category,项目中调用自己的 category 的地方实际走到了第三方SDK里面去了。最大的问题是,这2个同名 category 方法行为并不一致,导致出现 bug
现在问题来了,怎么寻找到底是哪个第三方SDK?方法完全包在.a里面。
其实只需使用image lookup -n即可:
(lldb) image lookup -n dictionaryWithXMLString:
2 matches found in /Users/jiangliancheng/Library/Developer/Xcode/DerivedData/VideoIphone-aivsnqmlwjhxapdlvmdmrubbdxpq/Build/Products/Debug-iphoneos/BaiduIphoneVideo.app/BaiduIphoneVideo:
        Address: BaiduIphoneVideo[0x00533a7c] (BaiduIphoneVideo.__TEXT.__text + 5414908)
        Summary: BaiduIphoneVideo`+[NSDictionary(SAPIXmlDictionary) dictionaryWithXMLString:] at XmlDictionary.m
         Module: file = "/Users/jiangliancheng/Library/Developer/Xcode/DerivedData/VideoIphone-aivsnqmlwjhxapdlvmdmrubbdxpq/Build/Products/Debug-iphoneos/BaiduIphoneVideo.app/BaiduIphoneVideo", arch = "armv7"
    CompileUnit: id = {0x00000000}, file = "/Users/jiangliancheng/Development/Work/iOS_ShareLib/SharedLib/Srvcs/BDPassport4iOS/BDPassport4iOS/SAPI/Extensive/ThirdParty/XMLDictionary/XmlDictionary.m", language = "Objective-C"
       Function: id = {0x23500000756}, name = "+[NSDictionary(SAPIXmlDictionary) dictionaryWithXMLString:]", range = [0x005a6a7c-0x005a6b02)
       FuncType: id = {0x23500000756}, decl = XmlDictionary.m:189, clang_type = "NSDictionary *(NSString *)"
         Blocks: id = {0x23500000756}, range = [0x005a6a7c-0x005a6b02)
      LineEntry: [0x005a6a7c-0x005a6a98): /Users/jiangliancheng/Development/Work/iOS_ShareLib/SharedLib/Srvcs/BDPassport4iOS/BDPassport4iOS/SAPI/Extensive/ThirdParty/XMLDictionary/XmlDictionary.m
         Symbol: id = {0x0000f2d5}, range = [0x005a6a7c-0x005a6b04), name="+[NSDictionary(SAPIXmlDictionary) dictionaryWithXMLString:]"
       Variable: id = {0x23500000771}, name = "self", type = "Class", location =  [sp+32], decl =
       Variable: id = {0x2350000077e}, name = "_cmd", type = "SEL", location =  [sp+28], decl =
       Variable: id = {0x2350000078b}, name = "string", type = "NSString *", location =  [sp+24], decl = XmlDictionary.m:189
       Variable: id = {0x23500000799}, name = "data", type = "NSData *", location =  [sp+20], decl = XmlDictionary.m:192
        Address: BaiduIphoneVideo[0x012ee160] (BaiduIphoneVideo.__TEXT.__text + 19810016)
        Summary: BaiduIphoneVideo`+[NSDictionary(XMLDictionary) dictionaryWithXMLString:] at XMLDictionary.m
         Module: file = "/Users/jiangliancheng/Library/Developer/Xcode/DerivedData/VideoIphone-aivsnqmlwjhxapdlvmdmrubbdxpq/Build/Products/Debug-iphoneos/BaiduIphoneVideo.app/BaiduIphoneVideo", arch = "armv7"
    CompileUnit: id = {0x00000000}, file = "/Users/wingle/Workspace/qqlive4iphone/iphone_4.0_fabu_20150601/Common_Proj/mobileTAD/VIDEO/Library/Third Party/XMLDictionary/XMLDictionary.m", language = "Objective-C"
       Function: id = {0x79900000b02}, name = "+[NSDictionary(XMLDictionary) dictionaryWithXMLString:]", range = [0x01361160-0x0136119a)
       FuncType: id = {0x79900000b02}, decl = XMLDictionary.m:325, clang_type = "NSDictionary *(NSString *)"
         Blocks: id = {0x79900000b02}, range = [0x01361160-0x0136119a)
      LineEntry: [0x01361160-0x01361164): /Users/wingle/Workspace/qqlive4iphone/iphone_4.0_fabu_20150601/Common_Proj/mobileTAD/VIDEO/Library/Third Party/XMLDictionary/XMLDictionary.m
         Symbol: id = {0x0003a1e9}, range = [0x01361160-0x0136119c), name="+[NSDictionary(XMLDictionary) dictionaryWithXMLString:]"
       Variable: id = {0x79900000b1e}, name = "self", type = "Class", location =  r0, decl =
       Variable: id = {0x79900000b2c}, name = "_cmd", type = "SEL", location =  r1, decl =
       Variable: id = {0x79900000b3a}, name = "string", type = "NSString *", location =  r2, decl = XMLDictionary.m:325
       Variable: id = {0x79900000b4a}, name = "data", type = "NSData *", location =  r2, decl = XMLDictionary.m:327
东西有点多,我们只需关注里面的file这一行:
CompileUnit: id = {0x00000000}, file = "/Users/jiangliancheng/Development/Work/iOS_ShareLib/SharedLib/Srvcs/BDPassport4iOS/BDPassport4iOS/SAPI/Extensive/ThirdParty/XMLDictionary/XmlDictionary.m", language = "Objective-C"
CompileUnit: id = {0x00000000}, file = "/Users/wingle/Workspace/qqlive4iphone/iphone_4.0_fabu_20150601/Common_Proj/mobileTAD/VIDEO/Library/Third Party/XMLDictionary/XMLDictionary.m", language = "Objective-C"
可以清晰的看到,LLDB给我们找出来了这个方法的位置。 当然这个命令也可以找到方法的其他相关信息,比如参数等.
image lookup –type
当我们想查看一个类型的时候,可以使用 image lookup –type,简写为image lookup -t:
e.g: 我们来看看Model的类型:
(lldb) image lookup -t Model
Best match found in /Users/jiangliancheng/Library/Developer/Xcode/DerivedData/TLLDB-beqoowskwzbttrejseahdoaivpgq/Build/Products/Debug-iphonesimulator/TLLDB.app/TLLDB:
id = {0x30000002f}, name = "Model", byte-size = 32, decl = Modek.h:11, clang_type = "@interface Model : NSObject{
    NSString * _bb;
    NSString * _cc;
    NSString * _name;
}
@property ( getter = name,setter = setName:,readwrite,nonatomic ) NSString * name;
@end
"
可以看到,LLDB把Model这个class的所有属性和成员变量都打印了出来,当我们想了解某个类的时候,直接使用 image lookup -t 即可。
其他
可以直接使用LLDB打开模拟器位置:
(lldb) po NSHomeDirectory()
/Users/mfw/Library/Developer/CoreSimulator/Devices/EAFE74A5-4C53-42CE-8B40-141380D73A6D/data/Containers/Data/Application/B4C48D8B-BD8B-4246-B9D7-15FEC3CA8662

(lldb) platform shell open /Users/mfw/Library/Developer/CoreSimulator/Devices/EAFE74A5-4C53-42CE-8B40-141380D73A6D/data/Containers/Data/Application/B4C48D8B-BD8B-4246-B9D7-15FEC3CA8662
常用的Debug快捷键
debug的时候,使用快捷键是一个很好的习惯,我简单列举了几个debug的快捷键
| 功能 | 命令 |
|---|---|
| 暂停/继续 | cmd + ctrl + Y |
| 断点失效/生效 | cmd + Y |
| 控制台显示/隐藏 | cmd + shift + Y |
| 光标切换到控制台 | cmd + shift + C |
| 清空控制台 | cmd + K |
| step over | F6 |
| step into | F7 |
| step out | F8 |
| 工程导航器 | Command+1 |
| 显示/隐藏导航器面板 | Command+0 |
| 显示/隐藏实用工具面板 | Command+Option+0 |
| 打开Assistant Editor | 项目导航器中选中文件执行Option+左键点击操作 |
| 展示方法列表 | Control+6(键入方法/变量名+Enter跳转 |
| 快速打开 | Command + Shift + O (字母O) |
| 文档和参考 | Command + Shift + 0 (数字0) |
| 快速帮助 | 在类或者方法名上执行Option + Left-click操作 |
| 展示当前你在工程导航器中打开的文件 | Command + Shift + J |
| 迷你窗口,可任意选择位置 | Command + Option + Shift + Left-click |
End
这是我比较常用的一些命令,不全但是有效,像那些 breakpoint 的功能,若不是使用 lldb调试可执行文件的话,直接使用 Xcode 的功能效果会更加显著一些。若想使用一些高级命令,可结合 python 脚本使用。
参考: